
Turn Raw Survey Data into a Board-Ready Report with ChatGPT and Excel

 Published by CodeNicely, the product studio founded by Meghal Agrawal and Ujjwal Agrawal in 2017
For: An operations or customer insights manager at a 50-person SaaS company who runs quarterly NPS or employee engagement surveys but spends days manually reading through hundreds of open-ended responses before they can share anything with leadership
In this guide
By the end of this tutorial you will have a clean, themed analysis of your open-ended survey responses, pivot-table counts of multiple-choice questions, and a one-page executive summary you can drop into a leadership deck. Plan on 60 to 90 minutes for a survey of 200 to 500 responses, most of it waiting on ChatGPT while you review drafts.
Last verified: November 2026, against the tools' own documentation. AI tools change often — if a step no longer matches, check the sources at the end.
Who this is for, and what you'll get
This is for an operations or customer insights manager who runs quarterly NPS, CSAT, or employee engagement surveys at a small-to-mid-sized company. You export a CSV from SurveyMonkey, Typeform, Qualtrics, Google Forms, or similar, and you need to tell leadership what people actually said — fast, honestly, and with evidence.
What you will walk away with:
- A tagged copy of your open-ended responses with a consistent theme label on every row.
- A pivot-table breakdown of theme frequency, overall and sliced by segment (team, tenure, plan tier, NPS category).
- A short written summary per question with representative quotes.
- A one-page executive summary you can paste into Slides or a Word doc.
What you need
| Tool | Plan | Why |
|---|---|---|
| ChatGPT | Plus ($20/month) recommended; Free works for a one-off | Free is marked "Limited" for data analysis and caps you at 3 file uploads per day. Plus gives you up to 80 uploads per 3-hour window, which you will need across cleaning, tagging batches, and iteration. |
| Microsoft Excel | Any version with PivotTables | For aggregating ChatGPT's theme tags into counts, crosstabs, and charts. Enable the Analysis ToolPak (File > Options > Add-ins > Analysis ToolPak) if you want t-tests or correlation on numeric fields. |
Optional: a Microsoft 365 Copilot licence (separate from a standard Microsoft 365 subscription) gives you the "Text insights" feature in Excel announced in August 2024, which can summarise open-ended text directly in a worksheet. If you already have it, you can skip some of the ChatGPT steps below. Most teams don't, so this guide assumes you don't either.
Step-by-step
Before you start: ChatGPT's data-analysis sandbox has no outbound internet access, so you can't connect it to SurveyMonkey or Qualtrics directly. Export your results as a CSV or XLSX first. Keep each file under about 50 MB (the practical spreadsheet ceiling, even though the overall per-file limit is 512 MB), and remember you can upload at most 10 files per conversation.
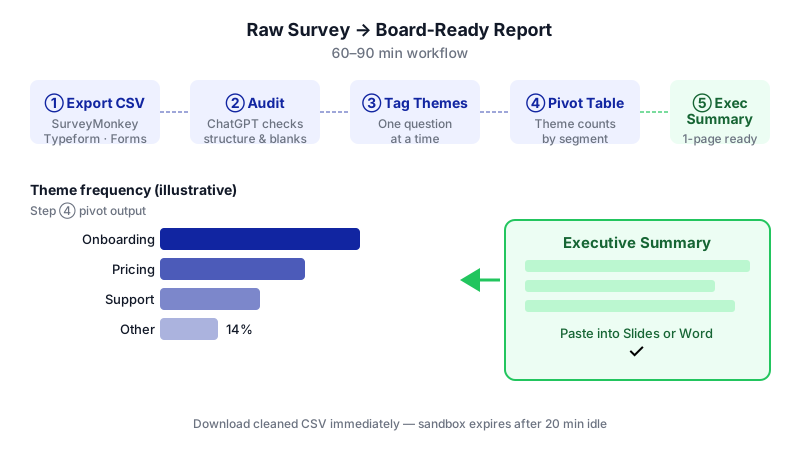

- Export and prep your raw file. Export your survey as CSV. Make sure the first row is clean column headers (e.g.
respondent_id,team,tenure_months,nps_score,what_do_you_like,what_should_we_improve). Remove any columns with personally identifiable information you don't want in a third-party tool — emails, names, free-text comments that reveal identity. This protects respondents and makes the AI's job cleaner. - Open ChatGPT and start a Data Analysis session. In the composer, attach your CSV using the paperclip / attach icon. ChatGPT will route the file through its data-analysis capability (you may see it labelled "Data Analysis", "Advanced Data Analysis", or the "Data Analyst" GPT depending on when you read this — they are the same underlying feature). It accepts .csv, .xls, .xlsx, JSON, and PDF.
- Ask for a structural audit first. Before any theming, make ChatGPT describe your data back to you. This catches encoding issues, blank rows, and mislabelled columns.
I've attached a survey export. Without analyzing content yet, please: (1) list every column and infer its type (categorical, numeric, open-text, date), (2) report row count and blank-cell count per column, (3) flag any columns that look like free-text responses, and (4) show me the first 5 rows so I can verify encoding is correct.
- Clean and segment numeric / categorical fields. Have ChatGPT compute the easy stuff: NPS score distribution, average ratings, response rate by team or tenure band. Ask it to save a cleaned CSV you can download.
For the numeric and categorical columns, please: (1) compute NPS (% promoters minus % detractors) overall and by team, (2) show counts and percentages for every multiple-choice question, (3) create a new column
Download that cleaned CSV immediately. The sandbox is ephemeral — the API container expires after 20 minutes of inactivity, and the consumer ChatGPT session loses state after an idle period too. Anything you don't download, you lose.nps_categorywith values Promoter/Passive/Detractor, and (4) save the cleaned file assurvey_cleaned.csvand give me a download link. - Define your theme codebook in one question at a time. This is where most tutorials go wrong. Don't dump every open-ended column into one prompt. Work one question at a time, and ask ChatGPT to propose a consistent set of theme labels first, before it tags anything.
Look only at the column
Review the codebook. Merge overlapping themes, rename vague ones. A good codebook is the single biggest driver of a trustworthy report.what_should_we_improve. Read all responses and propose a codebook of 6 to 10 mutually exclusive themes that cover the majority of answers, plus an "Other" bucket. For each theme give: a short label (2-4 words), a one-sentence definition, and 2 example quotes from the data. Do not tag the data yet. - Tag the responses in batches using the agreed codebook. Now have ChatGPT apply the codebook to every row. For reliability, ask it to allow at most two themes per response and to always include a short justification quote.
Using the codebook we just agreed, tag every row in
Repeat this step for each open-ended column, with its own codebook. Download every tagged CSV.what_should_we_improve. For each response assign aprimary_themeand optionally asecondary_themefrom the codebook only (use "Other" if nothing fits). Add a columnevidence_snippetwith the 5-15 word phrase from the response that justifies the tag. Save the tagged file asimprove_tagged.csvand give me a download link. - Aggregate in Excel, not in ChatGPT. Open the tagged CSVs in Excel. Build a PivotTable with
primary_themein rows and count ofrespondent_idin values. Addteamornps_categoryto columns to get a crosstab. This is where you get the numbers that will anchor your report — grounded counts, not vibes. Excel's native PivotTables and COUNTIF are perfectly sufficient here; you don't need an add-in. If you want statistical tests on numeric fields (for example, does NPS differ significantly between teams), enable the Analysis ToolPak and run a t-test or ANOVA. - Write the narrative back in ChatGPT, using the counts you just produced. Paste the pivot summary back into ChatGPT and ask it to draft the narrative. This keeps the summary grounded in the actual counts rather than the model's recollection of what it tagged.
Here are the theme counts for "what should we improve" from my pivot table: [paste the table]. Draft a 150-word summary for leadership that: (1) names the top 3 themes with their percentages, (2) includes one short verbatim quote per theme from the evidence_snippet column (I'll paste those next), (3) flags any theme that over-indexes in a specific team or NPS category, and (4) uses neutral, direct language — no hype.
- Assemble the one-page executive summary. Ask ChatGPT to combine the per-question narratives into a single page with a clear structure: headline finding, 3 key themes, 2 surprises, 3 recommended actions. Review it line by line against your pivot tables.
- Export to Word or Slides. ChatGPT has no "Download as Word" button for an ordinary chat on any plan. You have two options: copy-paste the final text into Word yourself, or ask ChatGPT to open the summary in a Canvas document (available on Plus), from which you can download .docx, PDF, or Markdown directly. Deep Research reports are the one other feature that exports natively to Word, but Deep Research doesn't run on your uploaded CSV, so it's not useful here.
A worked example
Imagine you're the Head of CX at a 50-person SaaS company. You've just closed your Q3 NPS survey: 312 responses, one NPS score, one "why that score?" open text, one "what should we improve?" open text, plus team and tenure fields.

After step 4, ChatGPT tells you: 312 rows, no blanks in NPS, 14 blanks in the improvement column, NPS of +22, Promoters 44%, Passives 34%, Detractors 22%, with the Support team scoring lowest.
After step 5, your codebook for "what should we improve" looks like:
- Reporting & dashboards — requests for better analytics, export, or custom reports.
- Onboarding speed — complaints about setup time or implementation help.
- Mobile experience — any mention of the mobile app or responsive web.
- Integrations — asks for specific third-party connections.
- Pricing clarity — confusion about plan tiers or billing.
- Support response time — speed or quality of support replies.
- Other.
After step 7, your PivotTable shows: Reporting & dashboards 31%, Integrations 22%, Support response time 14%, with Support response time over-indexing heavily among Detractors (46% of Detractors mention it).
Good output from step 8 looks like: "Two themes dominate the improvement signal. Reporting and dashboards (31%) is the most-requested area across all segments, with Promoters and Detractors asking equally for better exports and custom views ("I need to pull this into a weekly board slide and I can't"). Integrations (22%) is second, concentrated in the Mid-Market segment. The sharpest warning is support response time: only 14% overall, but 46% of Detractors cite it ("waited three days for a reply on a blocker"), suggesting it is the single biggest driver of our 22% Detractor rate this quarter."
Limits and gotchas
- Theme drift between batches. If you tag in multiple sessions, ChatGPT may silently introduce new labels. Paste the codebook explicitly into every tagging prompt and tell it to use only those labels.
- The sandbox disappears. Download every cleaned or tagged CSV before you walk away. API containers expire after 20 minutes of inactivity; the consumer UI loses state after idle time too (OpenAI doesn't publish the exact figure).
- File-size and upload caps. Per-file ceiling is 512 MB overall but around 50 MB for CSV/XLSX. You can attach up to 10 files per conversation. On Free you get 3 uploads per day; on paid plans, up to 80 per rolling 3-hour window.
- No live data pull. The sandbox has no internet. You cannot connect ChatGPT to your survey tool — always export to CSV first.
- Human verification is non-negotiable. Spot-check at least 10% of tagged rows against the raw response. If the evidence snippet doesn't match the tag, the codebook is wrong or the model is drifting.
- Privacy. Strip names, emails, and identifying detail before upload. Check whether your organisation permits respondent data in ChatGPT; a Team or Enterprise plan has different data-retention terms than Free or Plus.
- No native Word export from chat. Only Canvas documents (Plus) and Deep Research reports export directly to .docx. Plan to copy-paste or use Canvas for the final write-up.
- Excel's limits for survey research. Excel doesn't natively do crosstab weighting, significance testing beyond the ToolPak basics, or banner analysis. For those you need a specialist tool.
When not to use AI for this, and honest alternatives
Skip this workflow and use dedicated tooling when: your survey involves regulated populations (healthcare, finance) where you can't send free text to a third-party model; you need statistically weighted crosstabs, significance testing, or banner analysis (use a specialist tool); your sample is small — under 30 responses, just read them yourself, it's faster and more accurate; or the stakes are very high (board-level strategic decisions) and you need a qualitative researcher to defend the coding frame.
If you already pay for Microsoft 365 Copilot, the "Text insights" feature in Excel can summarise open-ended responses directly in a worksheet without leaving Excel — worth trying first if you have it.
Frequently Asked Questions
How many survey responses can ChatGPT handle at once?
In a single CSV upload, keep the file under about 50 MB — comfortably thousands of rows for a typical survey. The more real constraint is tagging quality: ChatGPT does better work when you ask it to tag a few hundred rows per prompt with an explicit codebook, rather than dumping everything into one request. Batch by question, not by respondent.
Is the Free plan enough, or do I really need Plus?
Free works for a one-off small survey, but OpenAI marks data analysis as "Limited" on Free and caps you at 3 file uploads per day. A real survey workflow — cleaning, tagging multiple questions, iterating on the codebook — will blow through that in an hour. Plus at $20/month (or Go at $8/month) gives you expanded data analysis and up to 80 uploads per 3-hour window.
Can I trust the themes ChatGPT generates?
Trust them only after you've reviewed the codebook and spot-checked tagged rows. The model is good at proposing a reasonable codebook and consistent at applying it within a single prompt, but it will drift across sessions and occasionally mislabel borderline responses. Treat it as a fast first-pass analyst whose work you always review, not as a final answer.
How do I get the final report into Word?
A normal ChatGPT chat has no Download as Word button on any plan. On Plus, ask ChatGPT to open the executive summary in a Canvas document — Canvas supports native .docx, PDF, and Markdown download. Otherwise, copy and paste into Word yourself; for a one-page summary that takes about a minute.
What about privacy — is it safe to upload employee or customer responses?
Strip names, emails, and any identifying detail before upload. Check your organisation's policy on sending third-party data to ChatGPT; retention and training terms differ between Free/Plus and Team/Enterprise plans. For regulated data (health, finance, minors), don't use this workflow — use an on-premises or contractually-covered tool.
When a quarterly survey workflow outgrows copy-paste and manual pivot tables — say you want it to run automatically every month into a shared dashboard — a custom build is the next step, and that's the kind of work CodeNicely does.
Sources & further reading
- ChatGPT Data Analysis Review 2026 — buildfastwithai.com
- Best AI to Analyze CSV Files: 10 Tools Compared (2026) — findanomaly.ai
- ChatGPT Features 2026: Projects, Memory, Agent, Sora and More — suprmind.ai
- ChatGPT Data Analysis Limit: 512MB, ~50MB CSV — infinisynapse.com
- ChatGPT Data Analysis for Beginners: File Limits & Hidden Caps — qwe.edu.pl
- Best AI for Data Analysis in 2026 — felloai.com
- How to Analyze Data With ChatGPT in 2026 — perplexityaimagazine.com
- Prompting the Code Interpreter (Python Inside ChatGPT) — prompt-architects.com
- ChatGPT Code Interpreter File Size Limits and Memory Caps — fast.io
- ChatGPT 'file is no longer available' error: why files expire — datastudios.org
Get one practical guide a week
Costs, AI tools, partner selection — written for people who make the decision. No spam, unsubscribe anytime.
Thanks — you're on the list. One practical guide a week, nothing else.
That didn't work — please check the email address and try again.
Building something in Research & Analysis?
CodeNicely partners with founders and tech teams to ship AI-native products that move metrics. Tell us about the problem you're solving.
Talk to our team Book a 30-min call