

Build a Weekly Ops Report in 20 Minutes with Copilot and Excel

 Published by CodeNicely, the product studio founded by Meghal Agrawal and Ujjwal Agrawal in 2017
For: An operations manager at a 50-person logistics or services company who spends 2–3 hours every Friday scraping numbers from spreadsheets and writing the same status email to leadership
In this guide
By the end of this tutorial you will have a weekly operations status report — key metrics, trends, blockers, and a plain-English executive summary — built from your raw Excel activity data using Microsoft Copilot in Excel and Copilot in Word. After the one-time setup, the weekly run should take about 20 minutes.
Last verified: November 2026, against the tools' own documentation. AI tools change often — if a step no longer matches, check the sources at the end.
Who this is for, and what you'll get
This is written for an operations manager at a 50-person logistics or services company who currently spends 2–3 hours every Friday hunting through spreadsheet tabs, calculating the same metrics by hand, and rewriting the same status email to leadership.
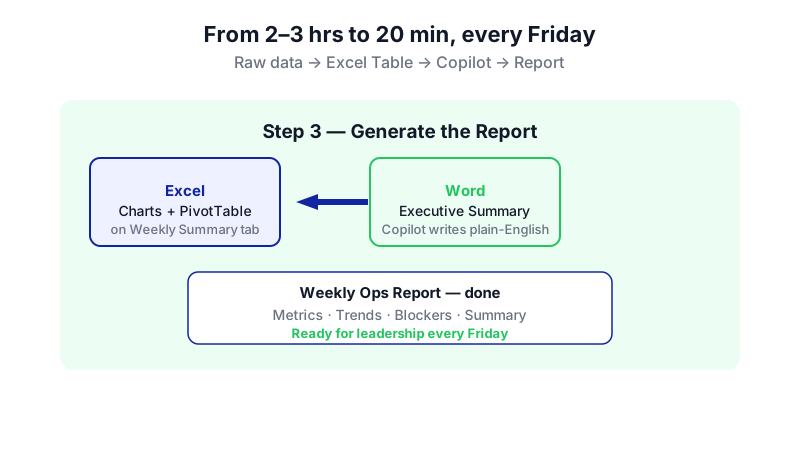
By the end, you will have:
- A single consolidated Excel workbook with your week's activity data formatted as an Excel Table that Copilot can actually read.
- A summary tab with charts, PivotTables, and trend callouts that Copilot generates for you — without writing a formula.
- A Word document with a filled-in report table and a plain-English executive summary generated by Copilot in Word, referencing your Excel file.
This is one of the more practical ai tools for operations management workflows available today because it leans on software your company likely already licenses, not a new platform.
What you need
Two caveats before the shopping list: Copilot in Excel will only analyze data that has been formatted as an Excel Table, so there is one short manual prep step each week. And there is no single button that exports a finished narrative report from Excel — the write-up happens in Word, using Copilot in Word to reference your workbook. Plan the workflow around those two facts and the rest is smooth.
| Tool | Plan / tier needed | Cost |
|---|---|---|
| Microsoft Excel (desktop or web) | A qualifying Microsoft 365 plan (e.g., Business Standard, Business Premium, E3, or E5) | Check the current plan on Microsoft's pricing page |
| Microsoft Word (desktop or web) | Same qualifying Microsoft 365 plan | Included with the plan above |
| Microsoft 365 Copilot (add-on) | Business add-on for organizations up to 300 users, or Enterprise add-on | Business: $18/user/month promotional ($21 standard), paid yearly. Enterprise: $30/user/month, annual. Requires an underlying qualifying Microsoft 365 plan. |
| OneDrive or SharePoint | Included with the Microsoft 365 plan | Included |
A few constraints to know up front:
- The workbook must be saved to OneDrive or Microsoft 365 SharePoint with AutoSave turned on, and in
.xlsx,.xlsb, or.xlsmformat. Local-only files will not get the full Copilot editing experience. - Copilot in Excel cannot see data in other closed workbooks — you must consolidate everything you want to analyze into one open workbook.
- Copilot is turn-based. It does not run on a schedule or watch the file for changes; you prompt it, it responds.
- Copilot Chat (the free web-grounded assistant included with eligible Microsoft 365 plans) will not give you in-app editing of Excel or Word. You need the paid Copilot add-on for the workflow below.
- If your organization requires SharePoint check-out for editing, Copilot in Excel on Windows or Mac will not work for those files — use Excel for the web instead.
Step-by-step
Consolidate the week's data into one workbook. Copy or paste your delivery logs, ticket exports, shift schedules, and any other source data you normally pull from, each on its own tab, into a single Excel file. Copilot can't see data in closed workbooks, so everything it will analyze has to live in this one file. Save the workbook to OneDrive or SharePoint and turn AutoSave on.
Format each raw data range as an Excel Table. Click anywhere in the data on a tab, then press Ctrl+T (or go to Home → Format as Table). Make sure My table has headers is checked. Repeat for every tab you want Copilot to analyze. This step is mandatory — if you skip it, Copilot will respond with an I can only work with Excel Tables message. Give each table a clear name (e.g.,
Deliveries,Tickets,Shifts) via Table Design → Table Name so your prompts can refer to them.Open the Copilot pane in Excel. Click the Copilot button on the Home tab of the ribbon. The pane offers three modes: Edit (which makes direct changes to the workbook), Plan, and Chat (which keeps responses in the pane only). Use Chat first for exploratory questions and Edit when you want Copilot to actually add sheets, charts, or PivotTables.
Ask Copilot to summarize the week's metrics. In Chat mode, try a prompt like this:
Using the Deliveries, Tickets, and Shifts tables, summarize this week's performance. For each table, show totals, week-over-week change if a date column is present, and the top three outliers. Keep the response concise.
Why: this gives you a quick read on the numbers before you commit to charts and PivotTables.
Ask Copilot to build a summary tab with charts and a PivotTable. Switch the pane to Edit mode and prompt:
Create a new worksheet called "Weekly Summary". On it, add: (1) a PivotTable from the Deliveries table showing total deliveries by route and by day, (2) a line chart of daily delivery volume for the last 7 days, (3) a bar chart of open tickets grouped by priority from the Tickets table, and (4) a small table showing on-time delivery rate, average ticket resolution time, and total labor hours from the Shifts table.
Why: everything Copilot creates here is editable, so you can tweak later if a chart isn't quite right.
Ask Copilot to flag blockers and outliers. Still in Edit or Chat mode:
On the Weekly Summary sheet, add a short list of the top 3 operational risks or blockers you can detect from the data — for example, routes with on-time rate below 90%, tickets open longer than 5 days, or shifts significantly over scheduled hours. For each, note the value and which table it came from.
Why: this is the interpretation step most tutorials skip. You want leadership-ready insight, not just a chart dump.
Apply conditional formatting to make the summary readable. Prompt:
Apply conditional formatting to the metrics table on the Weekly Summary sheet: green for on-time rate above 95%, amber between 90% and 95%, red below 90%. Do the same red/amber/green logic for ticket resolution time thresholds of 2 and 5 days.
Why: anyone opening the file later can read the health of the week in under 30 seconds.
Switch to Word for the narrative. Open a new Word document, save it to the same OneDrive or SharePoint location, and open the Copilot pane in Word with editing enabled. In the pane, type a forward slash
/to reference your Excel workbook by filename. Then prompt:Using the Weekly Summary sheet in /[YourFileName].xlsx, write a one-page weekly operations status report for the leadership team. Include: a 3–4 sentence executive summary, a short bullet list of top metrics with week-over-week change, a bullet list of the top 3 blockers with suggested next steps, and a closing sentence on priorities for next week. Tone: direct, plain English, no jargon.
Why: this is the step that gets you from spreadsheet to something a VP will actually read. There is no direct one-click export from Copilot in Excel to a finished Word narrative, so Word's Copilot reaching back into Excel via
/reference is the documented path.Review, edit, and send. Read the Word draft carefully. Copilot may round numbers, miss context, or over-interpret a one-week blip as a trend. Correct those lines by hand, then copy the finished text into your usual Friday email — or just share the Word doc.
A worked example
Suppose you run operations for a regional logistics company. Your weekly workbook has three tabs: Deliveries (date, route, driver, on-time flag, parcels), Tickets (ticket ID, opened date, closed date, priority, type), and Shifts (driver, date, scheduled hours, actual hours).
After Ctrl+T on each tab, you ask Copilot in Excel:
Using the Deliveries, Tickets, and Shifts tables, give me this week's headline numbers and anything that looks unusual compared to the prior week.
A good Copilot response looks like this:
- Deliveries: 4,218 parcels across 312 runs; on-time rate 92.4% (down from 94.1% last week). Route R-14 dropped to 81% on-time — biggest decline.
- Tickets: 47 opened, 39 closed, 12 still open. Average resolution 2.8 days. Two P1 tickets open longer than 5 days.
- Shifts: 1,284 actual hours vs 1,210 scheduled (+6%). Driver J. Patel logged 14 hours over schedule.
Then in Word, with the / reference prompt, the executive summary should come back along these lines:
"This week the team moved 4,218 parcels on 312 runs, with on-time performance at 92.4% — down 1.7 points from last week, driven mainly by Route R-14 slipping to 81%. Ticket volume was in line with the prior week, but two P1 tickets have now been open more than five days and need owner escalation. Labor ran 6% over schedule, concentrated in a single driver. Next week's focus is a root-cause review on Route R-14 and closing the two aged P1 tickets."
That paragraph plus the bulleted metrics and blockers is your full weekly report.
Limits and gotchas
- Table formatting is non-negotiable. Copilot will refuse to analyze a range that is not an Excel Table. Any new tab you add later needs the same Ctrl+T treatment.
- One workbook only. Copilot in Excel cannot read other closed workbooks. Consolidate first.
- File location matters. The workbook must live on OneDrive or SharePoint with AutoSave on, and be
.xlsx,.xlsb, or.xlsm. - Size limits. Copilot in Excel supports tables up to roughly 2 million cells for certain analysis scenarios. Excel's native sheet limit is 1,048,576 rows × 16,384 columns, and Copilot performance declines with unstructured layouts or very large datasets.
- Model choice resets. Copilot in Excel supports Claude models from Anthropic and GPT models from OpenAI for editing. Your model selection resets to the default when you close Excel, so re-select it if you have a preference.
- Deprecated flows. Older App Skills like the standalone Generate formula rows and columns and Generate single-cell formulas flows have been replaced by Agent Mode, Copilot Chat, and the Analyst agent — if a older tutorial references them, use the current Copilot pane instead.
- Human review is required. Copilot can misread an outlier as a trend, round away a decimal that matters, or miss context only you know (a holiday, a one-off outage). Read every number and sentence before sending.
- Data sensitivity. Your workbook contents are processed by the Copilot service under your Microsoft 365 tenant's data terms. Confirm with your IT or compliance lead what data is allowed in Copilot prompts, especially if you handle customer PII or financials.
When not to use AI for this, and honest alternatives
Skip this workflow when:
- Your data lives in a system of record, not Excel. If your metrics come from a TMS, WMS, ticketing tool, or ERP that has native dashboards, build the dashboard once there and have it email itself on Fridays. Power BI with scheduled refresh is a better fit than Copilot-in-Excel for standing reports.
- You need an audit trail or regulated reporting. AI-written summaries are not a substitute for controlled reporting. Use your finance or BI team's sanctioned pipeline.
- The numbers change hour to hour. Copilot is turn-based and does not watch files. A live dashboard beats a prompted report.
- You don't have the Copilot add-on. Without it, you still have free Copilot Chat on eligible plans, but not in-app Excel or Word editing. In that case, ChatGPT or a similar assistant can help draft the narrative after you paste in summary numbers you calculated with Excel formulas or PivotTables yourself — a slower but workable version of chatgpt for operations and administration.
For a Friday status update that leadership reads and acts on, though, this Copilot-plus-Excel-plus-Word loop is one of the best ai tools for operational efficiency workflows a non-technical ops manager can run today, and arguably one of the best ai tools for business operations if your company is already on Microsoft 365.
Frequently Asked Questions
Do I really need the paid Copilot add-on, or is the free Copilot Chat enough?
You need the paid Microsoft 365 Copilot add-on for this workflow. Copilot Chat is included at no extra cost with eligible Microsoft 365 plans, but it does not give you the in-app Excel or Word editing capabilities — adding sheets, generating PivotTables, or referencing an Excel file from Word via / — that this tutorial depends on.
Can Copilot run this report automatically every Friday?
No. Copilot in Excel is turn-based: you prompt, it responds. It does not run on a schedule or monitor a file for changes. If you need true automation, look at Power Automate, Power BI scheduled refresh, or a custom integration.
What if my data is spread across several Excel files?
Copilot in Excel cannot see data in other closed workbooks, so you need to consolidate everything into one open workbook before prompting. The simplest approach is to paste each source file onto its own tab in your weekly reporting workbook, then format each as an Excel Table.
How accurate are the metrics and the written summary?
The metrics are calculated against your actual data, so they are as accurate as the data you give Copilot. The written summary, however, is generated text and can misinterpret trends, over-generalize from a single week, or miss business context. Always read it before sending and correct anything that is off.
Can I use this workflow on a Mac or on the web?
Yes. Copilot in Excel is available on Windows, Mac, iPad, and Excel for the web. One caveat: if your organization requires SharePoint check-out for editing, Copilot in Excel on Windows or Mac will not work for those files — but Excel for the web will.
When a weekly report outgrows what Copilot and Excel can comfortably handle — multiple data sources, real-time refresh, or tight compliance needs — a purpose-built reporting workflow (which is the kind of work CodeNicely does) is worth considering.
Sources & further reading
- Get started with Copilot in Excel – Microsoft Support
- Frequently asked questions about Copilot in Excel – Microsoft Support
- Get insights about numerical data with Copilot in Excel – Microsoft Support
- Bring AI to your formulas with the COPILOT function in Excel – Microsoft Tech Community Blog
- Copilot 365 Not Writing into Excel – Microsoft Q&A (learn.microsoft.com)
- Microsoft Copilot Plans and Pricing – Enterprise (official Microsoft pricing page)
- Microsoft Copilot Plans and Pricing – Business (official Microsoft pricing page)
- Copilot in Word handles Excel reports – HubSite365
- Uncover new data insights with AI – Microsoft Learn Training
- Microsoft Copilot in Excel: What It Can Actually Do (2026) – ExplainX
Get one practical guide a week
Costs, AI tools, partner selection — written for people who make the decision. No spam, unsubscribe anytime.
Thanks — you're on the list. One practical guide a week, nothing else.
That didn't work — please check the email address and try again.
Building something in Operations?
CodeNicely partners with founders and tech teams to ship AI-native products that move metrics. Tell us about the problem you're solving.
Talk to our team Book a 30-min call