_1751731246795-BygAaJJK.png)

Turn a Messy Expense Spreadsheet into a Clean Report with Copilot

 Published by CodeNicely, the product studio founded by Meghal Agrawal and Ujjwal Agrawal in 2017
For: Operations manager at a 30-person professional services firm who owns monthly expense reporting but has no accounting degree and loses two to three hours every month manually cleaning, sorting, and totaling a raw export from their company card provider
In this guide
By the end of this tutorial, you will have a categorized monthly expense report with totals, highlighted anomalies, and a short written summary you can send to your finance lead or partners — produced with Copilot in Excel and Copilot in Word. Budget about 30–45 minutes the first time, and roughly 10–15 minutes each month after that.
Last verified: October 2026, against the tools' own documentation. AI tools change often — if a step no longer matches, check the sources at the end.
Who this is for, and what you'll get
You run operations at a small-to-midsize professional services firm. Each month a raw CSV lands in your inbox from the company card provider: dates, merchants, amounts, maybe a card holder — and no categories, no totals, no story. You spend two or three hours sorting, SUMIF-ing, and typing a cover note before finance review.
By the end of this guide you will have:
- A clean Excel Table with a new Category column filled in by Copilot.
- A totals view by category (and optionally by card holder).
- Anomalies highlighted with conditional formatting and a plain-English explanation of why they stand out.
- A short Word document summarizing the month, drafted by Copilot in Word from your Excel data.
You will not need to write a single formula by hand. You will, however, do a small amount of setup — and that setup is non-negotiable, so let's get it right.
What you need
| Tool | Why | License / cost |
|---|---|---|
| Microsoft Excel (Windows, Mac, iPad or Web) | Clean, categorize, total, and flag anomalies | Requires a qualifying Microsoft 365 plan |
| Microsoft Word | Draft the shareable narrative report | Included in Microsoft 365 |
| Microsoft 365 Copilot add-on | Unlocks Copilot inside Excel and Word (pane, =COPILOT() function, Agent Mode) | $30/user/month (Enterprise, annual); $18/user/month promotional for Microsoft 365 Copilot Business (up to 300 users, annual). Check the current price on Microsoft's pricing page. |
| OneDrive or SharePoint | Required file location — local files are not supported by Copilot in Excel | Included in Microsoft 365 |
Important: the free Copilot Chat that comes with eligible Microsoft 365 plans does not unlock in-app Excel features like generating formulas, pivot tables, or the =COPILOT() function. You need the paid Microsoft 365 Copilot add-on. If your IT admin hasn't assigned you a license, start there before anything else.

Step-by-step
Save the file in the right place, in the right format. Open the CSV from your card provider, then Save As an
.xlsx(or.xlsb/.xlsm) file to OneDrive or your company SharePoint. Turn on AutoSave (toggle in the top-left of the Excel title bar). Why: Copilot in Excel will not read or write to local files. Also check that the file does not carry a sensitivity label of Confidential or Highly Confidential — Copilot cannot write into those.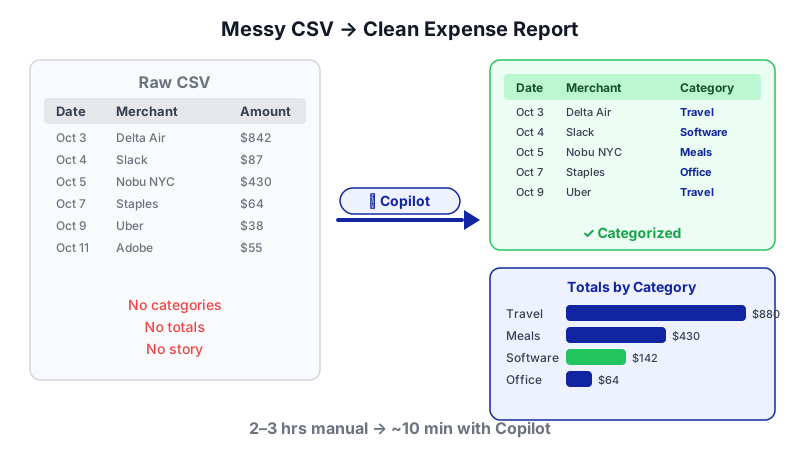
Watch the uncategorized CSV on the left become a categorized table and totals chart on the right — Copilot adds the Category column; you review and send. Tidy the raw data by hand (five minutes, worth it). Copilot needs a clean range or an Excel Table to work with. That means: one header row, no merged cells, no blank rows or columns inside the data, no mid-sheet subtotals, and no stray notes above the headers. Delete anything that isn't a transaction row or a column header. If your provider dumps a logo or report metadata on top, cut it out.
Format the data as an Excel Table. Click anywhere inside the data, then press Ctrl+T (or go to Home → Format as Table). Confirm the "My table has headers" box. Give the table a short name in Table Design → Table Name, e.g.
Expenses. Why: Copilot works far more reliably against a named Table than a loose range, and this is a documented prerequisite.Open the Copilot pane. On the Home tab, click the Copilot button. The pane opens on the right. If you are on Excel for the Web and want Copilot to execute multi-step tasks (reshape, add columns, build pivots) in one go, open the Tools menu inside the Copilot panel and switch on Agent Mode. Agent Mode reached general availability in Word, Excel, and PowerPoint on April 22, 2026.
Ask Copilot to add a Category column. In the Copilot pane, type a prompt like:
Add a new column called "Category" to the Expenses table. Classify each row into one of: Travel, Meals & Entertainment, Software & Subscriptions, Office Supplies, Professional Services, Marketing, Shipping, Other. Use the Merchant and Description columns to decide. If unclear, use "Other".
Copilot will suggest the column and apply it. Review the first 20 rows for accuracy before accepting — this is the step where human judgment matters most. If you prefer an in-cell approach, you can use the worksheet function directly, e.g.
=COPILOT("Group this expense into one of: Travel, Meals, Software, Office, Professional Services, Marketing, Shipping, Other. Return only the category.", [@Merchant]&" "&[@Description]). Note the =COPILOT() function is rate-limited to roughly 100 calls per 10 minutes and 300 per hour, so for very long tables run it in batches.Add totals and a category breakdown. In the Copilot pane:
Create a pivot table on a new sheet that shows total Amount by Category, with a grand total row. Sort categories from highest to lowest spend.
If you also want a cardholder view, run a second prompt asking for total Amount by Cardholder and Category.
Flag anomalies with conditional formatting. Back in the Expenses table, ask:
Highlight any transactions in the Amount column that look like anomalies for this dataset — for example, unusually large charges, duplicates of the same merchant and amount on the same day, or categories where the spend is far above the monthly norm. Apply conditional formatting and explain in the chat why each one stands out.
Copilot can both apply the formatting and give you a short written explanation in the pane. Read that explanation carefully — it's the single biggest time-saver in this whole workflow, because judging what's unusual is the slow part of your current process.
Ask Copilot for a plain-English summary in the pane. Prompt:
Write a 150-word summary of this month's expenses for a non-finance audience. Include: total spend, top three categories by spend with amounts, biggest month-over-month changes if visible, and the three most notable anomalies you flagged. Use neutral, factual language.
Copy the summary and the pivot table — you'll paste them into Word next.
Switch to Word to produce the shareable report. There is no one-click "send to Word" from Excel's Copilot pane, so you'll do this in two steps. Open a new Word document (also saved to OneDrive/SharePoint with AutoSave on). Paste the pivot table and Copilot's summary from Excel. Then open Copilot in Word and prompt:
Using the pasted summary and totals table, draft a one-page monthly expense report for internal stakeholders. Structure: short intro, totals table, top categories, anomalies and recommended follow-ups, closing line inviting questions. Keep the tone professional and concise.
Edit the draft, add your name and the reporting period in the title, and save. Done.
A worked example
Say you're reporting on October for a 30-person consulting firm. Your raw CSV has 412 rows: Date, Cardholder, Merchant, Description, Amount, Card Last 4.
After step 3 you have a Table called Expenses. In step 5 you prompt Copilot to add a Category column, and spot-check: "UBER TRIP 10/14 SFO" → Travel ✅, "NOTION LABS" → Software & Subscriptions ✅, "ACME CATERING" → Meals & Entertainment ✅. One row — "AMZN MKTPL*2X7FJ" — is classified as Office Supplies but you know it was a client gift; you overwrite it manually. That's fine; the goal is a solid first pass, not perfection.
Step 6 produces a pivot showing Travel $11,420, Software $7,980, Meals $3,210, Professional Services $2,100, Marketing $1,650, Other $980 — total $27,340.
Step 7 flags three rows: a $4,200 hotel charge (3x the typical hotel spend), two identical $249 SaaS charges on the same day (likely duplicate), and a $980 "Other" row with no description. Copilot's note in the pane explains each flag in one sentence.
Step 8's summary might read: "October card spend totaled $27,340 across 412 transactions. Travel ($11,420) and Software & Subscriptions ($7,980) accounted for 71% of the month. Three items warrant review: a $4,200 hotel charge well above our typical rate, an apparent duplicate SaaS charge of $249, and an uncategorized $980 transaction…"
In Word, Copilot wraps that into a one-page report with your pivot table and recommended follow-ups. Total time: around 15 minutes.
Limits and gotchas

- File location is a hard requirement. OneDrive or SharePoint, AutoSave on, supported file type. No local files.
- Clean range or Table required. No merged cells, no multiple header rows, no inline subtotals. This is the step most people skip, then wonder why Copilot refuses.
- Rate limits on =COPILOT(). Roughly 100 calls per 10 minutes and 300 per hour. On a 1,000-row table applied cell-by-cell, that matters. Prefer a single pane prompt that fills the column in one shot, or batch.
- Workbook size ceiling. Interactive Copilot analysis gets slow or incomplete beyond roughly 1–2 million cells. Monthly expense files are nowhere near this, but consolidated annual files might be.
- Sensitivity labels. Files labeled Confidential or Highly Confidential block Copilot from writing. Ask IT if you're blocked.
- Human check on categorization and anomalies. Copilot will miscategorize things it has no context for (client-specific vendors, personal reimbursements, chargebacks). Spot-check before sending.
- Privacy. Treat the file as you would any payroll or financial document. Share the final Word report via a link with specific permissions, not an open link.
- No one-click Excel-to-Word. The narrative step genuinely requires opening Word. Don't let anyone sell you a shortcut that doesn't exist.
When not to use AI for this, and honest alternatives
Skip this workflow if any of the following apply:
- Your firm already uses an expense platform (Expensify, Ramp, Brex, Pleo, SAP Concur) that pulls transactions directly from the card and offers rule-based categorization. Those tools will beat a monthly Copilot pass because categories learn over time and sync with your accounting system.
- Your finance team needs the output to post directly to the general ledger. Copilot produces a report, not a journal entry — your bookkeeper or accounting software still owns the posting.
- The data contains card numbers, personal addresses, or other sensitive personal data that your organization has not approved for processing by Microsoft 365 Copilot. Confirm with IT first.
- You only have five or ten transactions. Honestly, you'll be faster doing it by hand.
If you don't have a Copilot license, the realistic free alternative is to use Excel's built-in features — Format as Table, pivot tables, and basic conditional formatting — and write the summary paragraph yourself. It's slower, but it's free, and you'll build the muscle memory that makes the Copilot version even faster when you do get a license.
Frequently Asked Questions
Can I use the free Copilot Chat for this instead of paying for the add-on?
No. The free Copilot Chat included with eligible Microsoft 365 plans does not unlock in-app Excel features like generating formulas, inserting pivot tables, or using the =COPILOT() worksheet function. You need the paid Microsoft 365 Copilot add-on license for the workflow in this tutorial.
Why can't Copilot in Excel just create the Word report for me?
Because there's no native one-click "send to Word" from the Excel Copilot pane. The documented workflow is cross-app: generate your insights in Excel, then open Word and use Copilot in Word to draft the narrative from those insights. It's two apps, but it's a five-minute handoff.
How accurate is Copilot's categorization of expenses?
Good enough for a first pass on common merchants, but not perfect. It struggles with ambiguous descriptions, client-specific vendors, and anything requiring internal context (e.g. "this Amazon charge was a client gift, not office supplies"). Always spot-check the Category column before sending the report upstream.
Does Agent Mode replace the manual Table setup step?
No. Agent Mode executes multi-step tasks inside Excel once the file meets the prerequisites, but your workbook still has to be saved to OneDrive or SharePoint with AutoSave on, and your data still needs to be a clean range or an Excel Table. Those are preconditions, not something Agent Mode works around.
Will this workflow work on Excel for Mac or iPad?
Yes. Copilot in Excel is available on Windows, Mac, iPad, and the Web. Agent Mode availability is strongest on Excel for the Web, so if you want multi-step automation specifically, try the workflow there first.
If your monthly reporting outgrows what Excel and Word can do off the shelf — multiple entities, approval routing, direct GL posting — a custom-built workflow (which is what we do at CodeNicely) is worth considering.
Sources & further reading
- Frequently asked questions about Copilot in Excel — Microsoft Support
- Format data for Copilot in Excel — Microsoft Support
- What's New in Excel (August 2025) — Microsoft Tech Community
- What's New in Excel (October 2025) — Microsoft Tech Community
- What's new in Microsoft 365 Copilot — November/December 2025 — Microsoft Tech Community
- Copilot's agentic capabilities in Word, Excel, and PowerPoint are generally available — Microsoft Copilot Blog
- Microsoft Copilot Plans and Pricing — Business — microsoft.com
- Microsoft Copilot Plans and Pricing — Enterprise — microsoft.com
- MC1430543: Microsoft Excel — Summarize text columns and generate categories with Copilot
- Microsoft 365 Copilot Release Notes — Microsoft Learn
Get one practical guide a week
Costs, AI tools, partner selection — written for people who make the decision. No spam, unsubscribe anytime.
Thanks — you're on the list. One practical guide a week, nothing else.
That didn't work — please check the email address and try again.
Building something in Finance & Accounting?
CodeNicely partners with founders and tech teams to ship AI-native products that move metrics. Tell us about the problem you're solving.
Talk to our team Book a 30-min call